Computer Games Industry Analysis
Overview
Analysis of gaming trends using Steam data
Dataset
70,000+ games (2013–2025)
Key Questions
- How do real-world events affect gaming activity?
- What caused the rise of indie games?
- Do violent games follow real-world trends?
Key Insights
- Gaming activity increased during COVID-19
- Indie games grew after Steam policy changes
- Violent games remain consistently popular
Tools Used
- Tableau
- Python
Interactive Dashboard
Democracy and Economic Perception
Overview
Do people judge democracy by GDP numbers or by how their wallet actually feels? Using World Values Survey data across 60+ countries, this study finds that subjective economic perception — not objective indicators like GDP or unemployment — is the only statistically significant predictor of satisfaction with democracy. The vibes, it turns out, win.
Dataset
World Values Survey Wave 7 (2017-2022), World Bank, V-Dem Institute — 88,499 respondents across 60+ countries
Key Questions
- Do people judge democracy based on GDP, or how they personally feel about the economy?
- Does democracy quality actually predict satisfaction with democracy?
- Which individual factors (age, education, income) matter for democratic satisfaction?
Key Insights
- Economic perception is the only statistically significant predictor across all three models
- GDP, unemployment, and democracy quality score show no significant effect once perception is controlled
- Older and more educated people report higher satisfaction with democracy
- The perception gap — not the numbers — is what drives democratic legitimacy
Tools Used
- Python
- pandas
- OLS Regression
- World Values Survey
- World Bank Data
- V-Dem
Visualizations
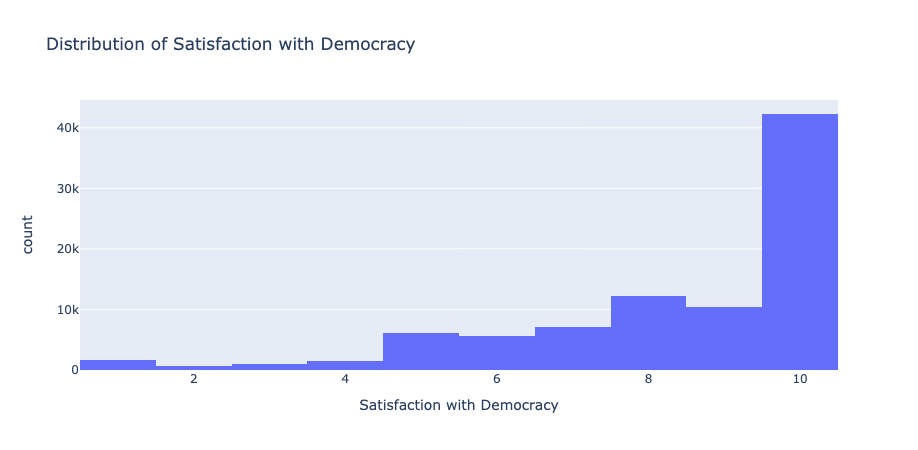
Distribution of Satisfaction with Democracy
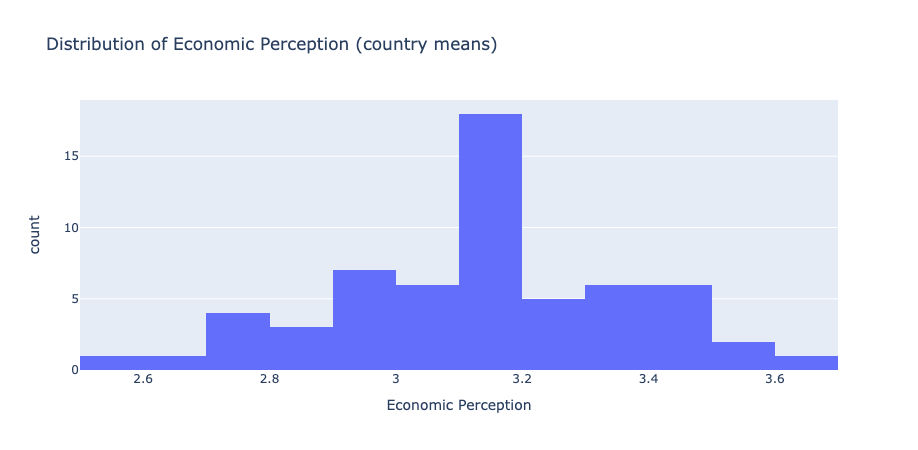
Distribution of Economic Perception across countries
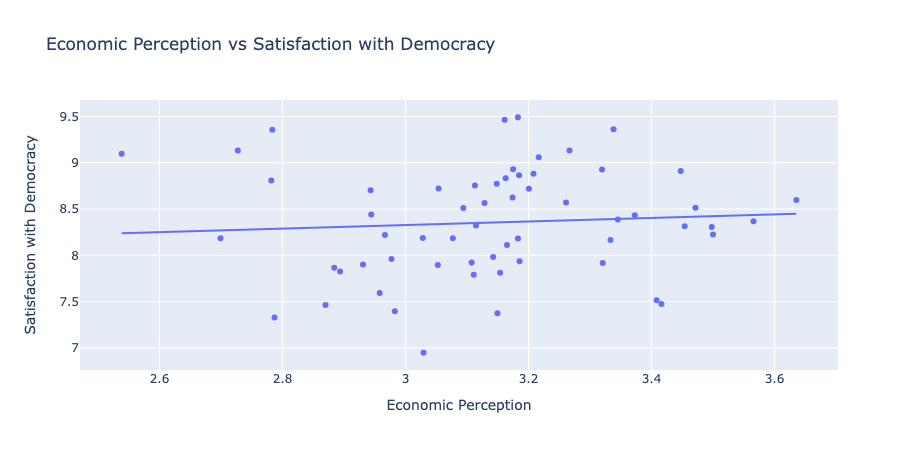
Economic Perception vs Satisfaction with Democracy
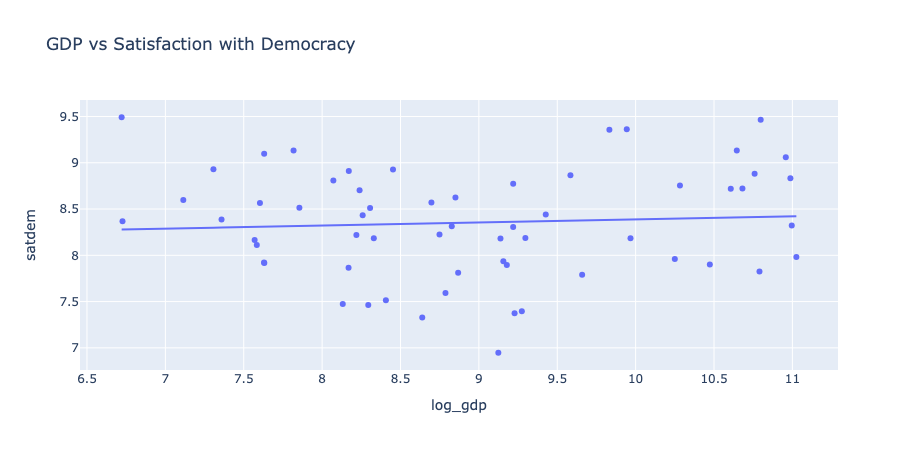
GDP vs Satisfaction with Democracy
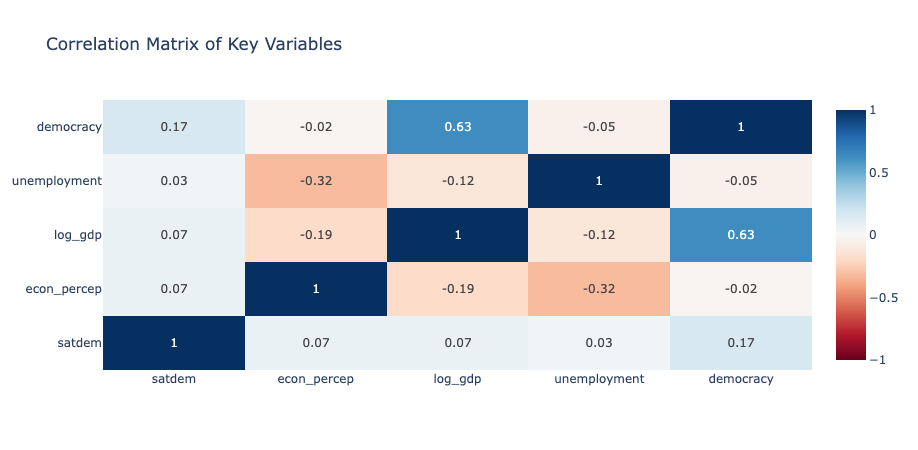
Correlation Matrix of Key Variables